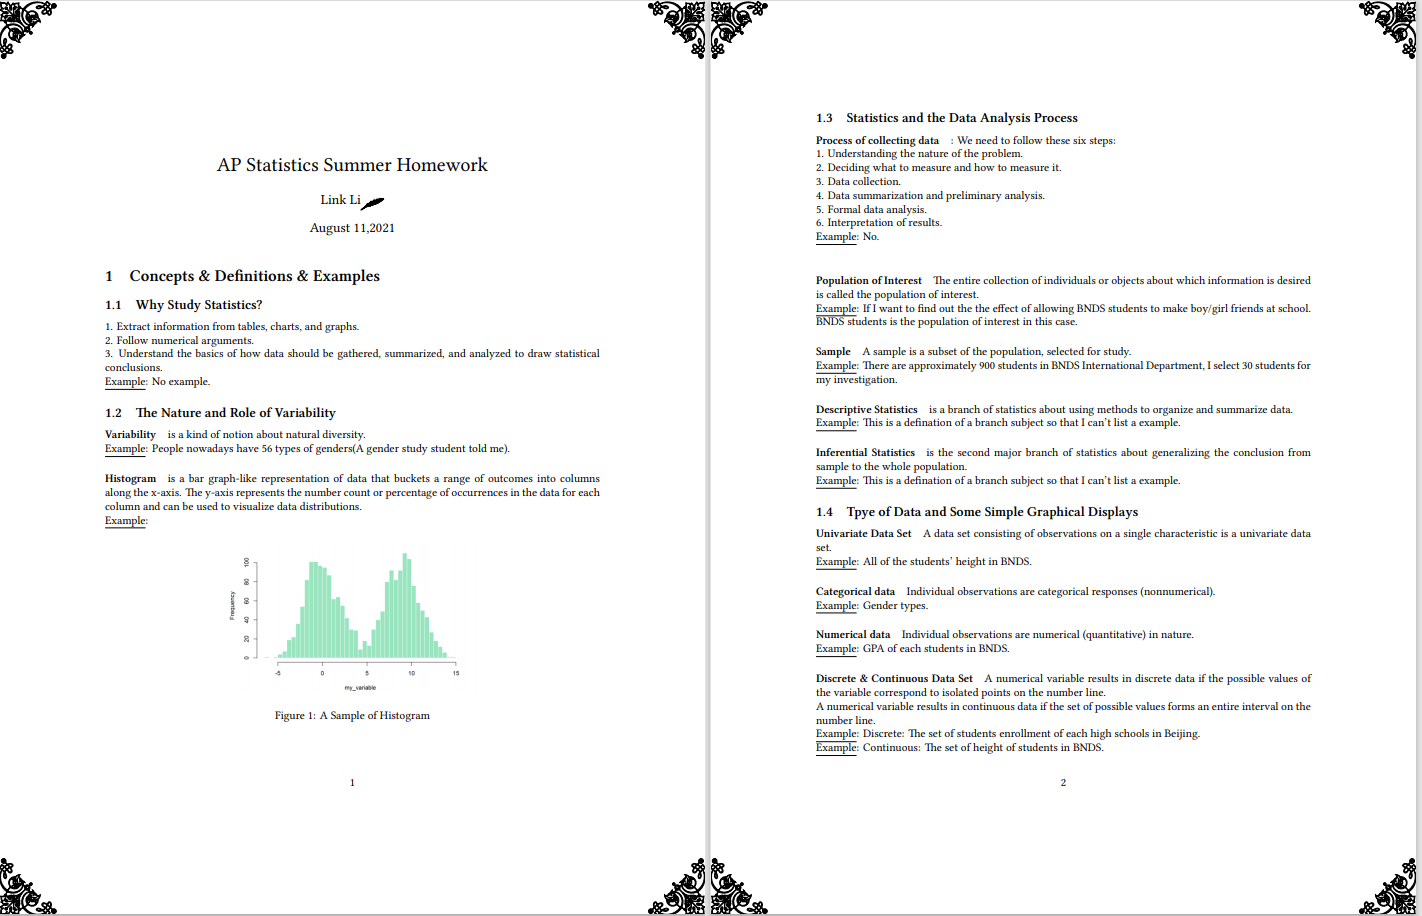
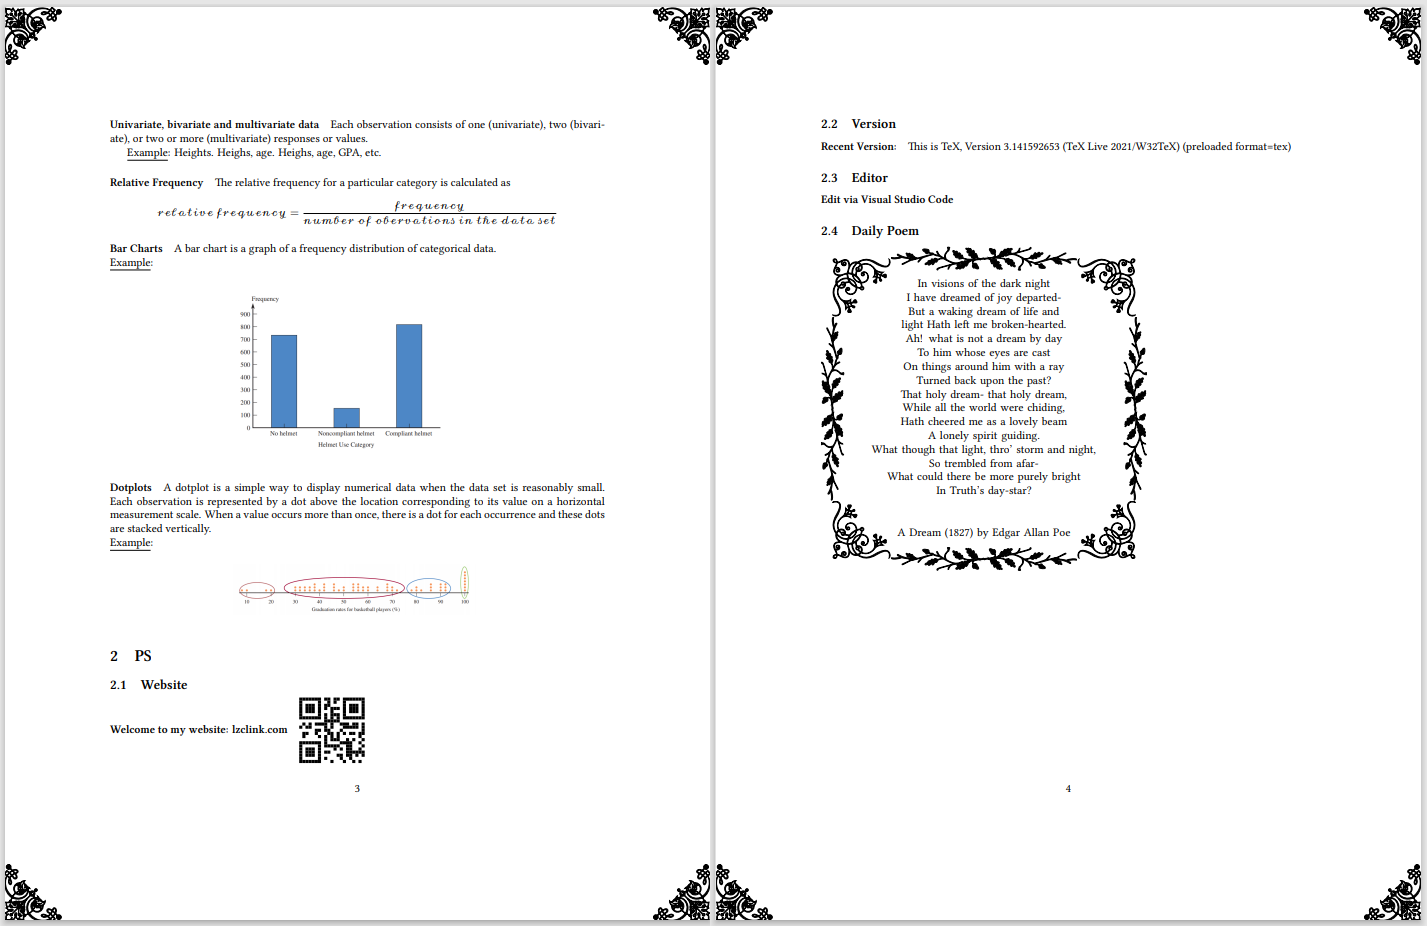
my_first_LaTeX_homework
Abstract
I heard about LaTeX from Ben. He told me our school’s previous Calculus 3 teacher stipulated that students in his class must use LaTeX to write their homework. At the beginning of summer vacation, I started to learn some basic knowledge about LaTeX. Thanks to my C++ knowledge, I have learned some of the rudimentary knowledge about LaTeX. However, if some complex demands appear, I could only use it as a Google-based language(LOL). This is my AP Statistics Course Summer Homework. Made by LaTeX, edited by VS code.
Source Code
\documentclass{article}
\title{AP Statistics Summer Homework}
\author{Link Li\pgfornament[width=0.7cm]{94}}
\date{August 11,2021}
\usepackage{graphicx}
\usepackage{tikz}
\usepackage{geometry}
\usepackage{qrcode}
\usepackage{pgfornament}
\usepackage{eso-pic}
\usepackage{tikzrput}
%\usepackage{boondox-cal}
%\usepackage{amsmath}
\usepackage{boondox-calo}
\usepackage{fontspec}

\setmainfont{LinLibertine_R.otf}[BoldFont=LinLibertine_RZ.otf,ItalicFont=LinLibertine_RI.otf,BoldItalicFont=LinLibertine_RZI.otf,]
\setsansfont{LinBiolinum_R.otf}[BoldFont=LinBiolinum_RB.otf,ItalicFont=LinBiolinum_RI.otf,BoldItalicFont=LinBiolinum_RBO.otf]
\setmonofont{LinLibertine_M.otf}[BoldFont=LinLibertine_MB.otf,ItalicFont=LinLibertine_MO.otf,BoldItalicFont=LinLibertine_MBO.otf]


\usetikzlibrary{positioning, arrows.meta, chains, scopes, calc}
\newcommand\AtPageUpperRight[1]{\AtPageUpperLeft{%
 \put(\LenToUnit{\paperwidth},\LenToUnit{0\paperheight}){#1}%
 }}%
\newcommand\AtPageLowerRight[1]{\AtPageLowerLeft{%
 \put(\LenToUnit{\paperwidth},\LenToUnit{0\paperheight}){#1}%
 }}%
\AddToShipoutPictureBG{%
   \AtPageUpperLeft{\put(0,-25){\pgfornament[width=1.75cm]{63}}}
   \AtPageUpperRight{\put(-50,-25){\pgfornament[width=1.75cm,symmetry=v]{63}}}
   \AtPageLowerLeft{\put(0,25){\pgfornament[width=1.75cm,symmetry=h]{63}}}
   \AtPageLowerRight{\put(-50,25){\pgfornament[width=1.75cm,symmetry=c]{63}}}
}
\begin{document}

\maketitle

\section{Concepts \& Definitions \& Examples}
\subsection{Why Study Statistics?}
1. Extract information from tables, charts, and graphs.\\
2. Follow numerical arguments.\\
3. Understand the basics of how data should be gathered, summarized, and analyzed to draw statistical conclusions.\\
\underline{Example}: No example.
\subsection{The Nature and Role of Variability}
\paragraph{Variability}
is a kind of notion about natural diversity. \\
\underline{Example}: People nowadays have 56 types of genders(A gender study student told me).
\paragraph{Histogram}
is a bar graph-like representation of data that buckets a range of outcomes into columns along the x-axis. The y-axis represents the number count or percentage of occurrences in the data for each column and can be used to visualize data distributions.\\
\underline{Example}:

\begin{figure}[htbp]
\centering
\includegraphics[width= .5\textwidth]{histogram.png}
\caption{A Sample of Histogram}
\end{figure}

\subsection{Statistics and the Data Analysis Process}
\paragraph{Process of collecting data}
: We need to follow these six steps:\\
1. Understanding the nature of the problem.\\
2. Deciding what to measure and how to measure it.\\
3. Data collection.\\
4. Data summarization and preliminary analysis.\\
5. Formal data analysis. \\
6. Interpretation of results.\\
\underline{Example}: No.\\

\paragraph{Population of Interest}
The entire collection of individuals or objects about which information is desired is called the population of interest.
\\
\underline{Example}: If I want to find out the the effect of allowing BNDS students to make boy/girl friends at school. BNDS students is the population of interest in this case.
\paragraph{Sample}
A sample is a subset of the population, selected for study.
\\
\underline{Example}: There are approximately 900 students in BNDS International Department, I select 30 students for my investigation.

\paragraph{Descriptive Statistics}
is a branch of statistics about using methods to organize and summarize data.
\\
\underline{Example}: This is a defination of a branch subject so that I can't list a example.

\paragraph{Inferential Statistics}
is the second major branch of statistics about generalizing the conclusion from sample to the whole population.
\\
\underline{Example}: This is a defination of a branch subject so that I can't list a example.
\subsection{Tpye of Data and Some Simple Graphical Displays}

\paragraph{Univariate Data Set}
A data set consisting of observations on a single characteristic is a univariate data set.
\\
\underline{Example}: All of the students' height in BNDS.


\paragraph{Categorical data}
Individual observations are categorical responses (nonnumerical).
\\
\underline{Example}: Gender types.


\paragraph{Numerical data}
Individual observations are numerical (quantitative) in nature.
\\
\underline{Example}: GPA of each students in BNDS.


\paragraph{Discrete \& Continuous Data Set}
A numerical variable results in discrete data if the possible values of the variable correspond to isolated points on the number line.
\\
A numerical variable results in continuous data if the set of possible values forms an entire interval on the number line.
\\
\underline{Example}: Discrete: The set of students enrollment of each high schools in Beijing.
\\
\underline{Example}: Continuous: The set of height of students in BNDS.


\paragraph{Univariate, bivariate and multivariate data}

Each observation consists of one (univariate), two (bivariate), or two or more (multivariate) responses or values.

\underline{Example}: Heights. Heighs, age. Heighs, age, GPA, etc.


\paragraph{Relative Frequency}

The relative frequency for a particular category is calculated as
\[
    \mathcal{relative\ frequency = \frac{frequency}{number\ of\ obervations\ in\ the\ data\ set}}
\]


\paragraph{Bar Charts}
A bar chart is a graph of a frequency distribution of categorical data.
\\
\underline{Example}:
\begin{figure}[htbp]
\centering
\includegraphics[width= .5\textwidth]{bar.png}
\end{figure}

\paragraph{Dotplots}
A dotplot is a simple way to display numerical data when the data set is reasonably
small. Each observation is represented by a dot above the location corresponding to
its value on a horizontal measurement scale. When a value occurs more than once,
there is a dot for each occurrence and these dots are stacked vertically.
\\
\underline{Example}:
\begin{figure}[htbp]
\centering
\includegraphics[width= .5\textwidth]{dd.png}
\end{figure}

\section{PS}
\subsection{Website}
\paragraph{Welcome to my website: lzclink.com}
\qrcode{lzclink.com}

\subsection{Version}
\paragraph{Recent Version:}
This is TeX, Version 3.141592653 (TeX Live 2021/W32TeX) (preloaded format=tex)
\subsection{Editor}
\paragraph{Edit via Visual Studio Code}
\subsection{Daily Poem}

\begin{tikzpicture}
    \node[text width=8cm,align=center](Text){%
    In visions of the dark night\\
    I have dreamed of joy departed-\\
    But a waking dream of life and light\
    Hath left me broken-hearted.\\

    Ah! what is not a dream by day\\
    To him whose eyes are cast \\
    On things around him with a ray \\
    Turned back upon the past? \\

    That holy dream- that holy dream,\\
    While all the world were chiding,\\
    Hath cheered me as a lovely beam\\
    A lonely spirit guiding.\\

    What though that light, thro' storm and night,\\
    So trembled from afar- \\
    What could there be more purely bright \\
    In Truth's day-star? \\
    \vspace{24pt}
     A Dream (1827) by Edgar Allan Poe
    } ;

    \node[inner sep=0pt,shift={(-.5cm,.5cm)},anchor=north west](CNW)  at (Text.north west)
         {\pgfornament[width=1.75cm]{61}};
    \node[inner sep=0pt,shift={(.5cm,.5cm)},anchor=north east](CNE)   at (Text.north east)
         {\pgfornament[width=1.75cm,symmetry=v]{61}};
    \node[inner sep=0pt,shift={(-.5cm,-.5cm)},anchor=south west](CSW) at (Text.south west)
         {\pgfornament[width=1.75cm,symmetry=h]{61}};
    \node[inner sep=0pt,shift={(.5cm,-.5cm)},anchor=south east](CSE)  at (Text.south east)
         {\pgfornament[width=1.75cm,symmetry=c]{61}};
    \pgfornamenthline{CNW}{CNE}{north}{87}
    \pgfornamenthline{CSW}{CSE}{south}{87}
    \pgfornamentvline{CNW}{CSW}{west}{87}
    \pgfornamentvline{CNE}{CSE}{east}{87}
    \end{tikzpicture}

\end{document}
Result

